
Debug
Show dialog
Show some text in a debug dialog. Essentially the same as Dialog.info("Debug", text).
Parameters
textthe text to display
Example
Debug.showDialog("hello there");Debug.ger
The Debug.ger() method pauses the running flow (as any other dialog) and shows a debugger dialog which includes an inspector and a REPL (read-eval-print loop).
Inspector
The inspector window lets you inspect the global values in the flow as well as the argument given. The variables are displayed in a tree which can be expanded to reveal the structure of the objects.
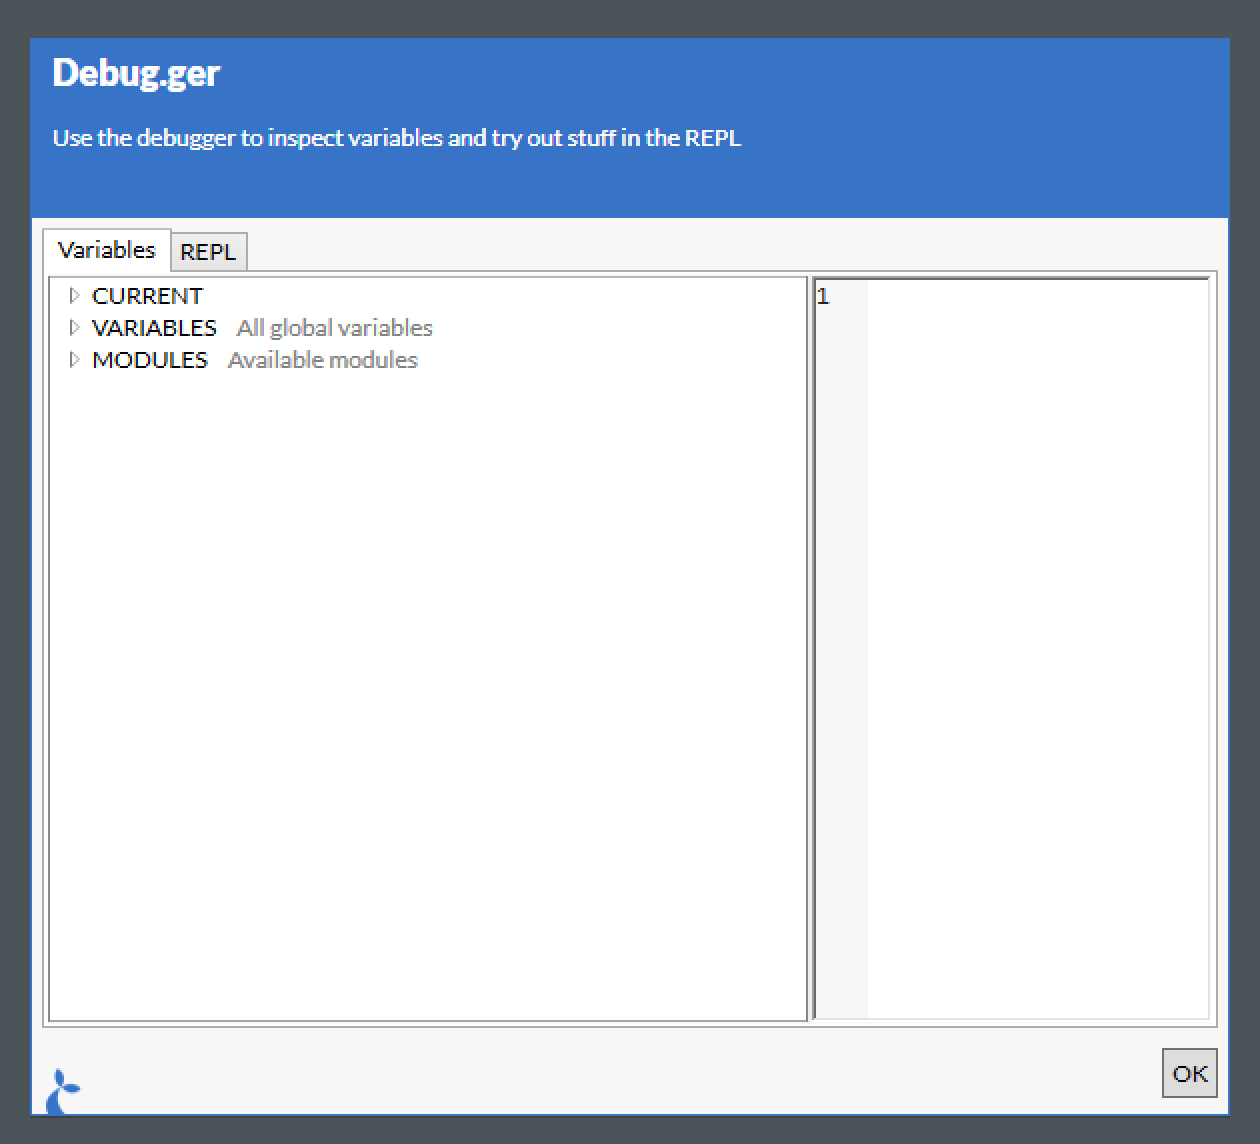
The debugger shown above was shown with the following code:
var x = { foo:'bar', baz: 123 };
Debug.ger(x);
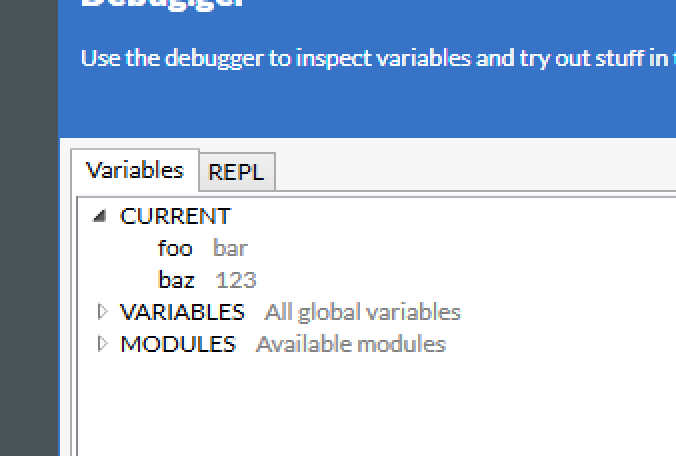
Expanding the CURRENT node will give you:
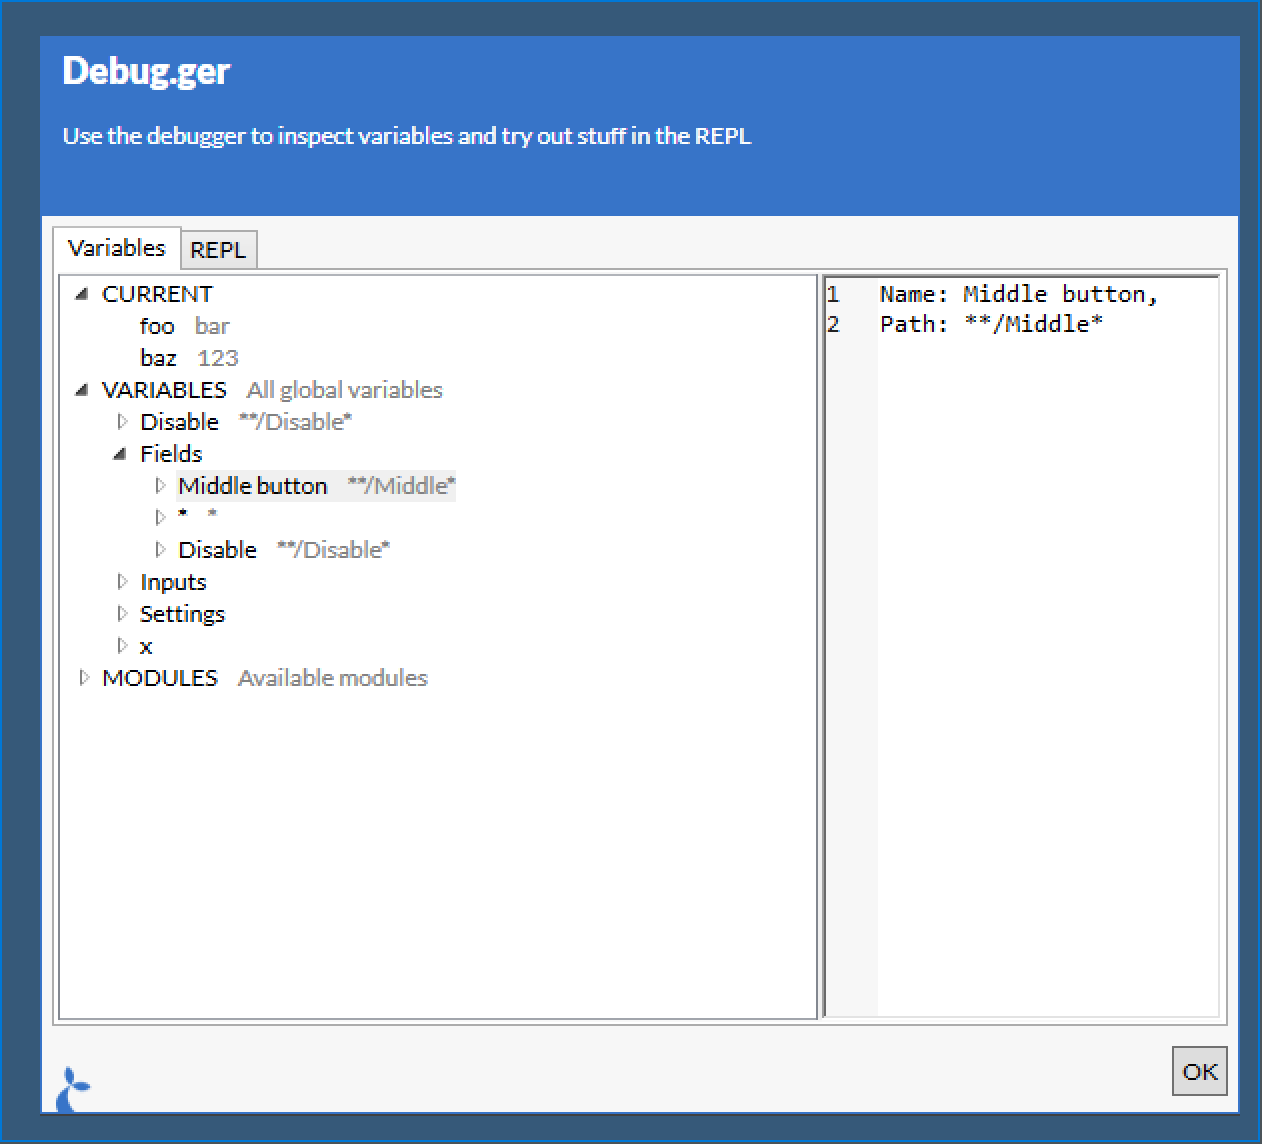
You can also explore the global variables (those defined in the outermost) scope of a flow. Here we show a field.
REPL
The REPL tab of the Debug.ger can be used to try running small snippets of code in the context of the current flow. You can do anything via the REPL that you can do in a flow.
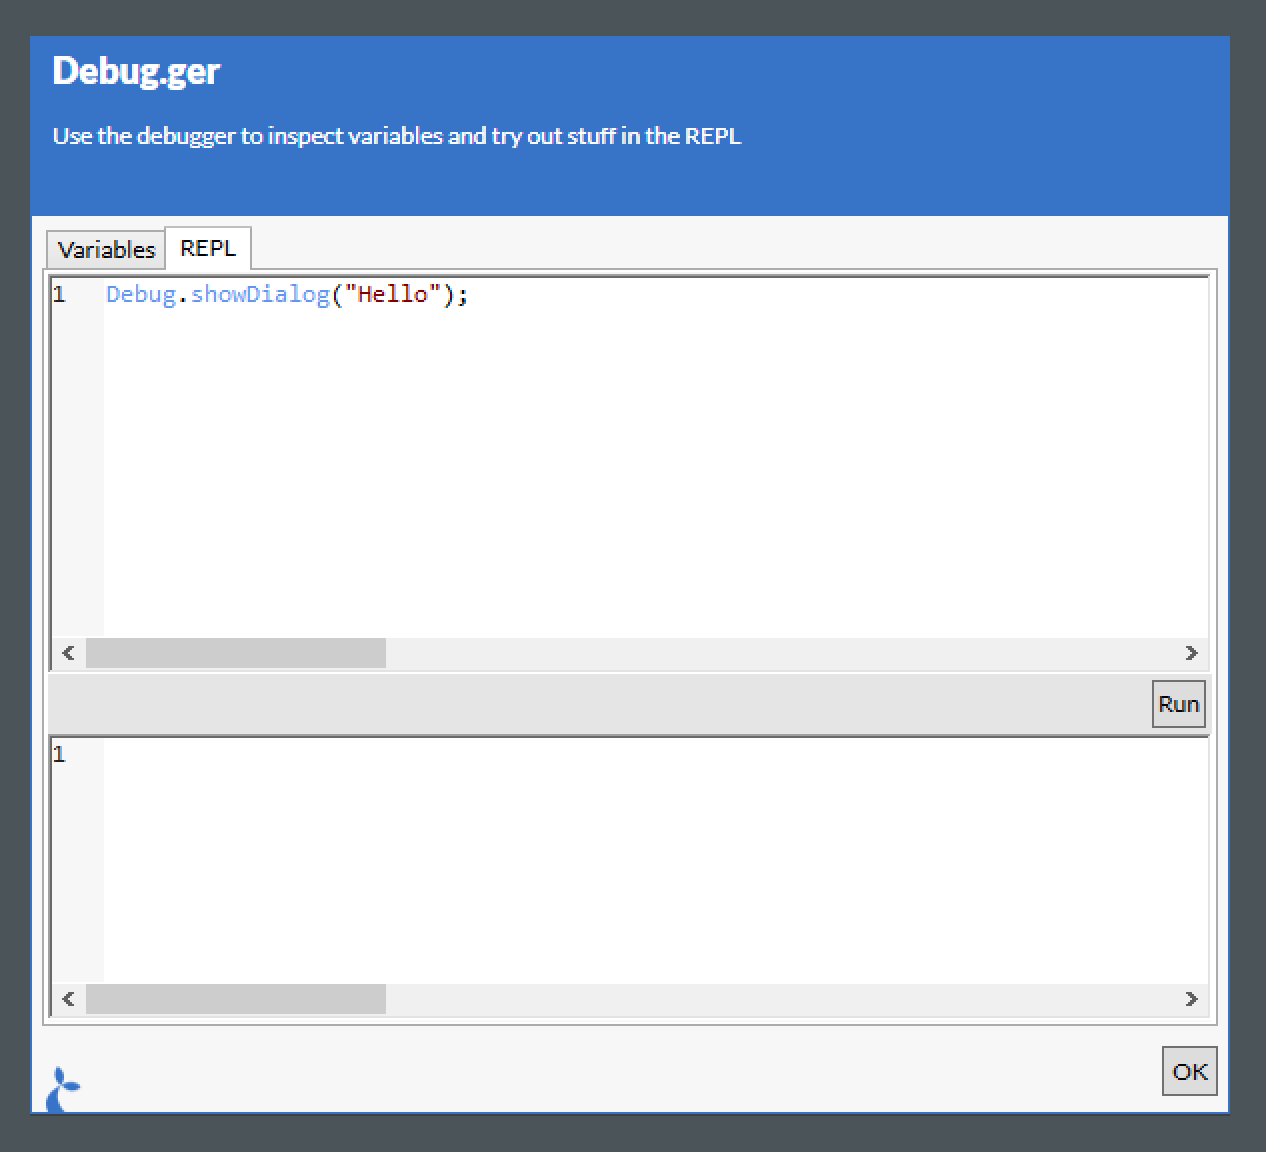
Clicking the “Run” button will run the code written and display the time it took to run as well as the result.
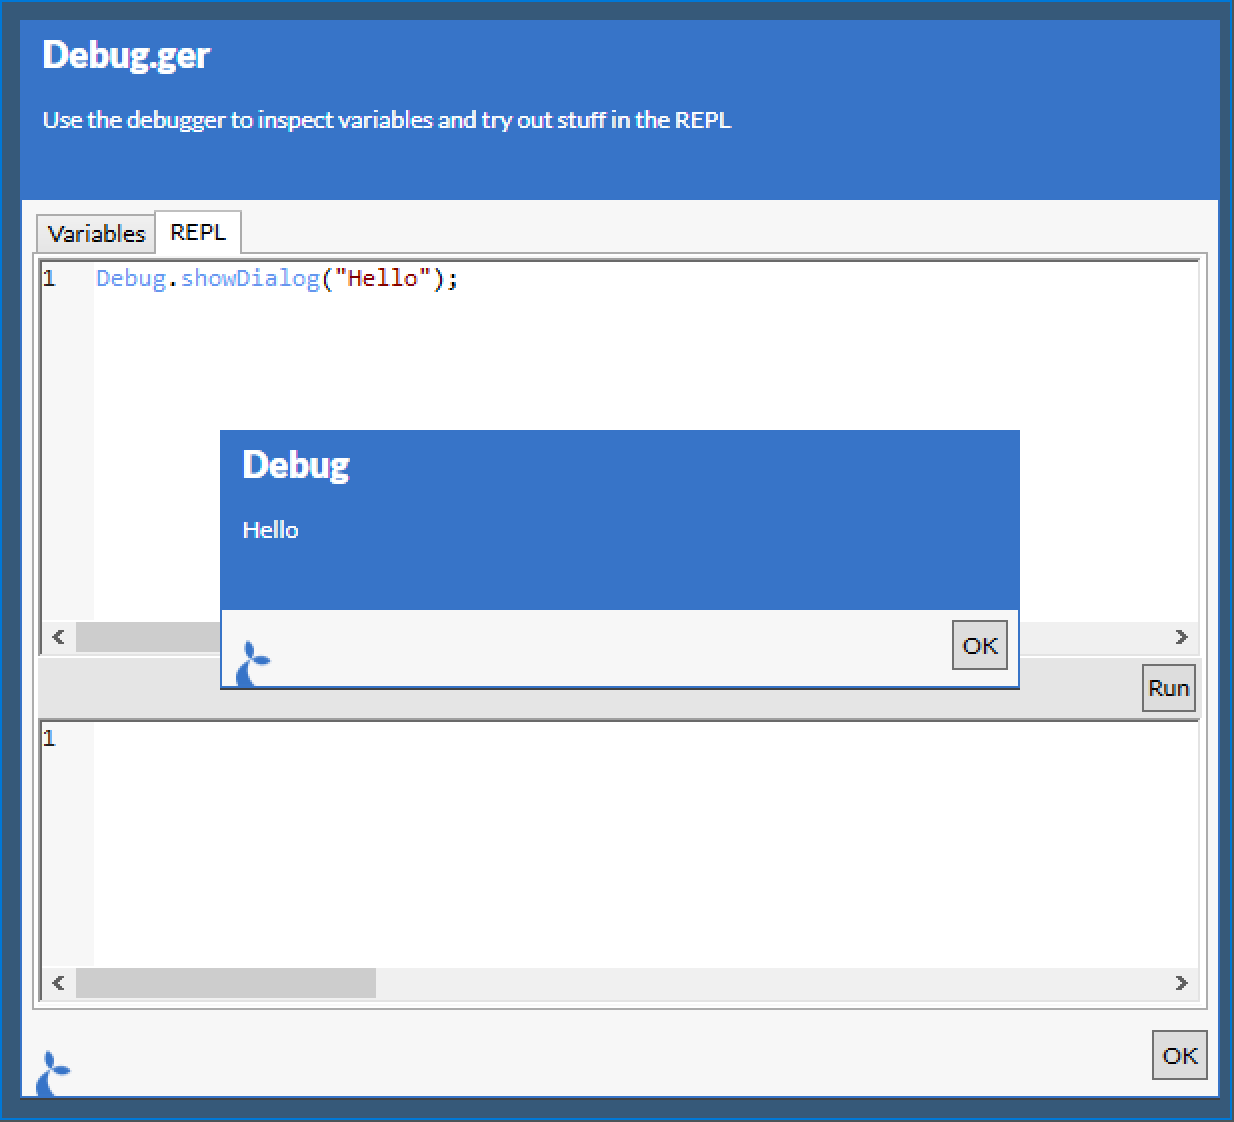
This method can also be used as Debug.attach() and Debug.inspect() but some of us prefer the simplicity and raw hipster essence of Debug.ger().
Debug dialog size
The Debug.ger window can be resized by dragging its bottom-right corner.
Debug.break
Debug.break() pauses the flow when it is being debugged through the flow tracer or through Cuesta. Outside of a debugging session it does nothing, so it is safe (but not necessarily good practice) to leave in production flows.
Parameters
messagean optional message to record with the break
Example
Debug.break();

// Or break only when something interesting has happened
if (numErrors > 0) Debug.break('Errors detected!');